The Signal from the Black Cube
The concept of Saturn being like a radio broadcasting antenna is not as far-fetched, as it may sound; particularly after the Cassini probe picked up regular kilometric radio emissions coming from the Gas Giant, back in 2004.


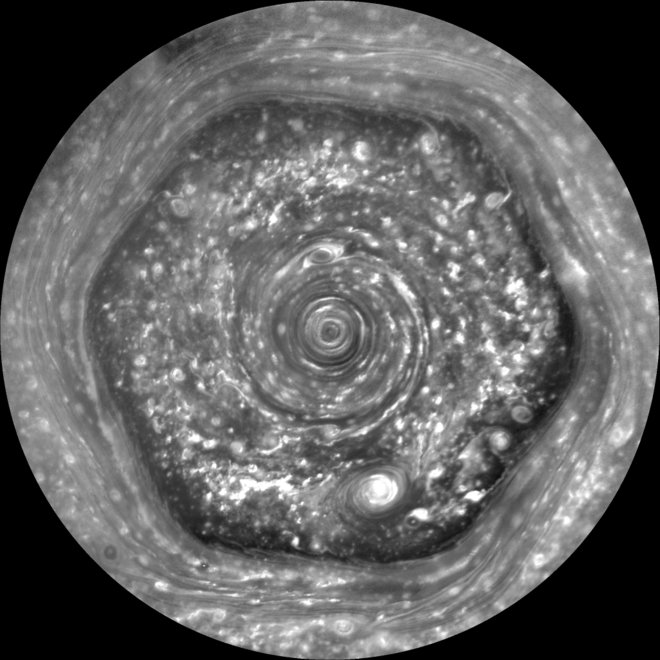
Cassini WMap: Kilometric radiation from Saturn’s pole (Left) and the Enigmatic Hexagon on Saturn’s North Pole (Right).
The signal received from Saturn was in the form of three crescendoing spikes emerging from a baseline tone. The regular structure of the signal intrigued and confounded scientists, as they wondered what it could possibly mean. They concluded that the radio emissions originate from Saturn’s auroral discharges from both its North and South poles.
Cassini WMap: Kilometric radiation from Saturn’s pole. The North Pole of Saturn is famously the location of a hexagonal storm. Could the regular emissions be linked to the regular geometric structure of the storm? It seemed like a long shot, but it was actually the talisman from ‘9’ and the three alchemical principals, which gave me the idea and made me think that it might work.
I began by transforming the Cassini spectrograph image using polar coordinates. Interestingly, this resulted in the inclined crescendoes transposing into broad sweeping strokes. And there is was; the Hecate Triformis. This gave me more confidence to try it with a higher quality image.
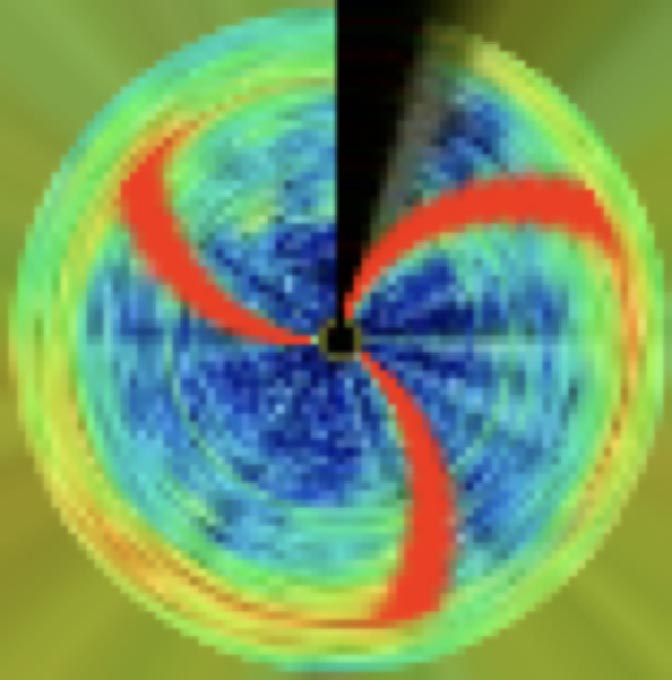
Proto-type image of the Cassini signal, revealing tripartite structure.
My second attempt revealed the same sweeping structure and I played around with different rotations until I settled on the below image;
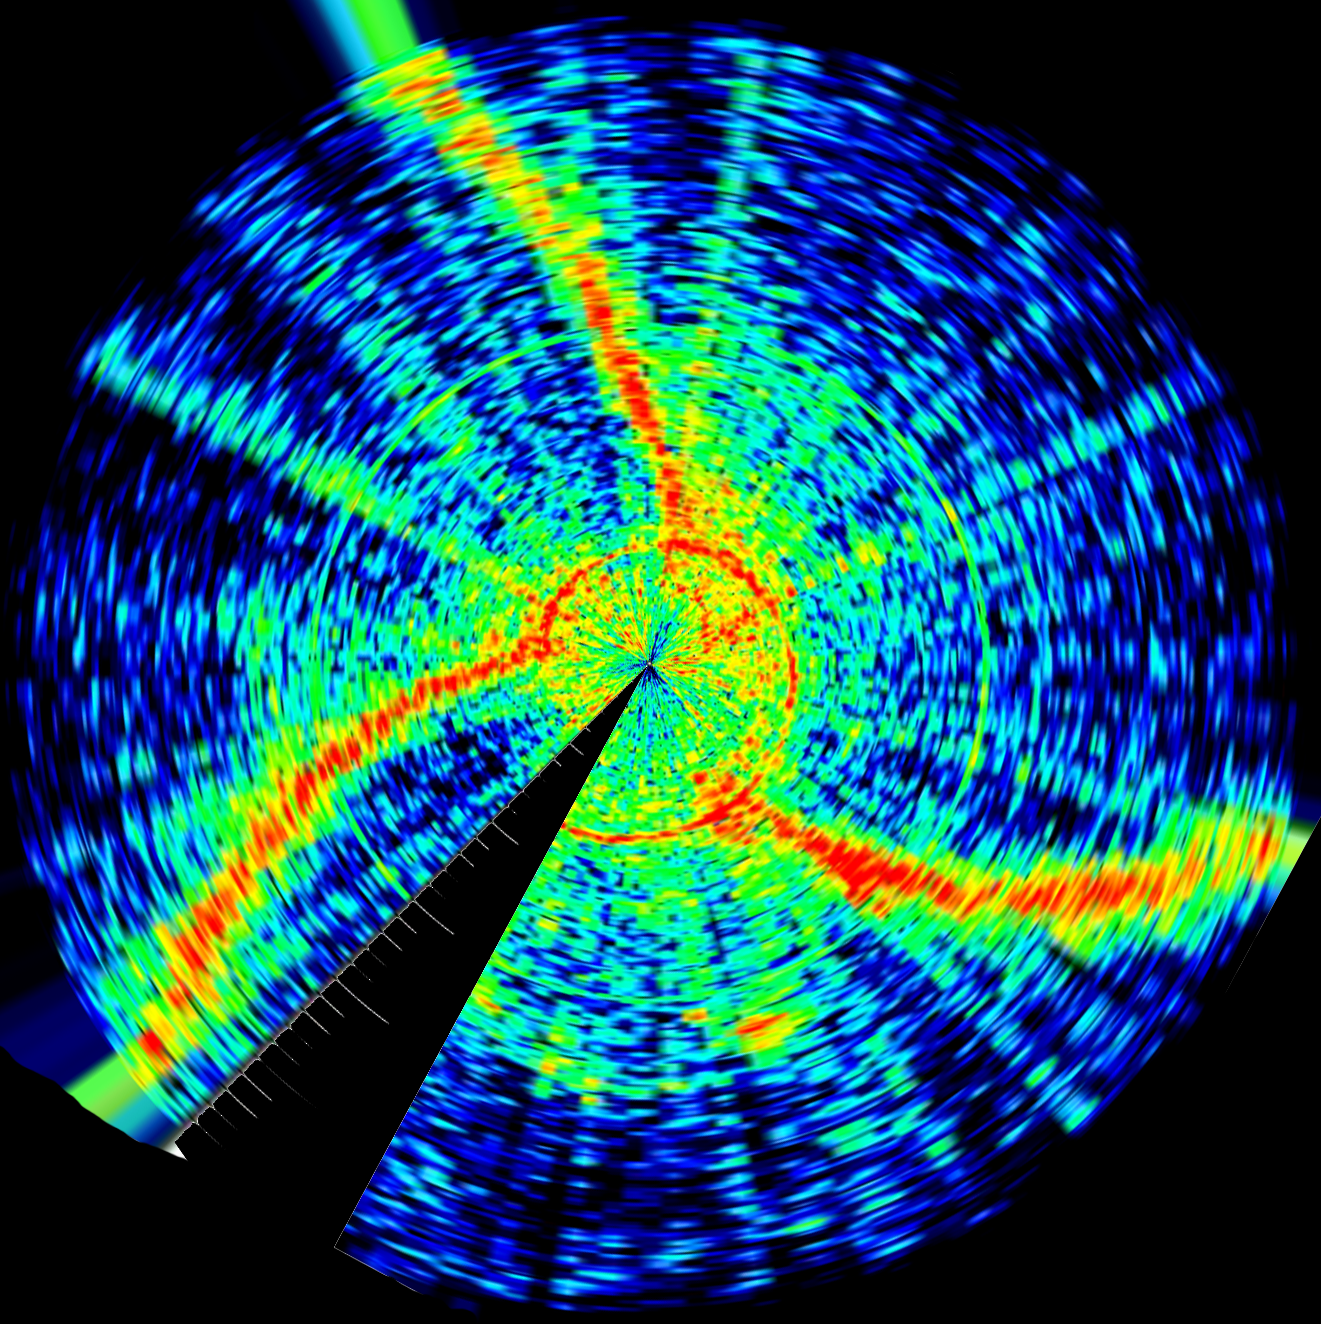
As I compared it to the Saturn Hexagon, I noticed that there was a bright red spot about mid-way out from the centre of the kilometric radio data, which appeared to match the position of the Great White Storm on the bottom right of the Hexagon. On a whim I decided to rotate the image so that the two aligned. The result from this was that many of the structures in both images matched with a high degree of accuracy.
The places were the data matches up the most is in the middle band, where there is less distortion due to the polar coordinate transformation. But there are still some striking concordances to the centre of both images. The most convincing, in my mind, is the bright green line that runs exactly mid-way out from the rotating centre and passes directly through the Great White storm. Also the red spiral at the centre formed by the baseline conforms perfectly to the inner vortex of the Hexagon. What are the chances of this happening? Well, if we look at string theory, which gives the sum of all vibrational waves as -1/12, then it looks like we have a negative probability of this occurring, meaning it is next to impossible. While negative probabilities appear to contradict common sense, in the case of mutli-dimensional physics like string theory they do have a place. It seems to me that the driving force of the Saturn Hexagon is this tripartite radio sound wave that is emerging from the pole and sweeping across the detector on the Cassini probe. Or perhaps, more likely it is the other way around.
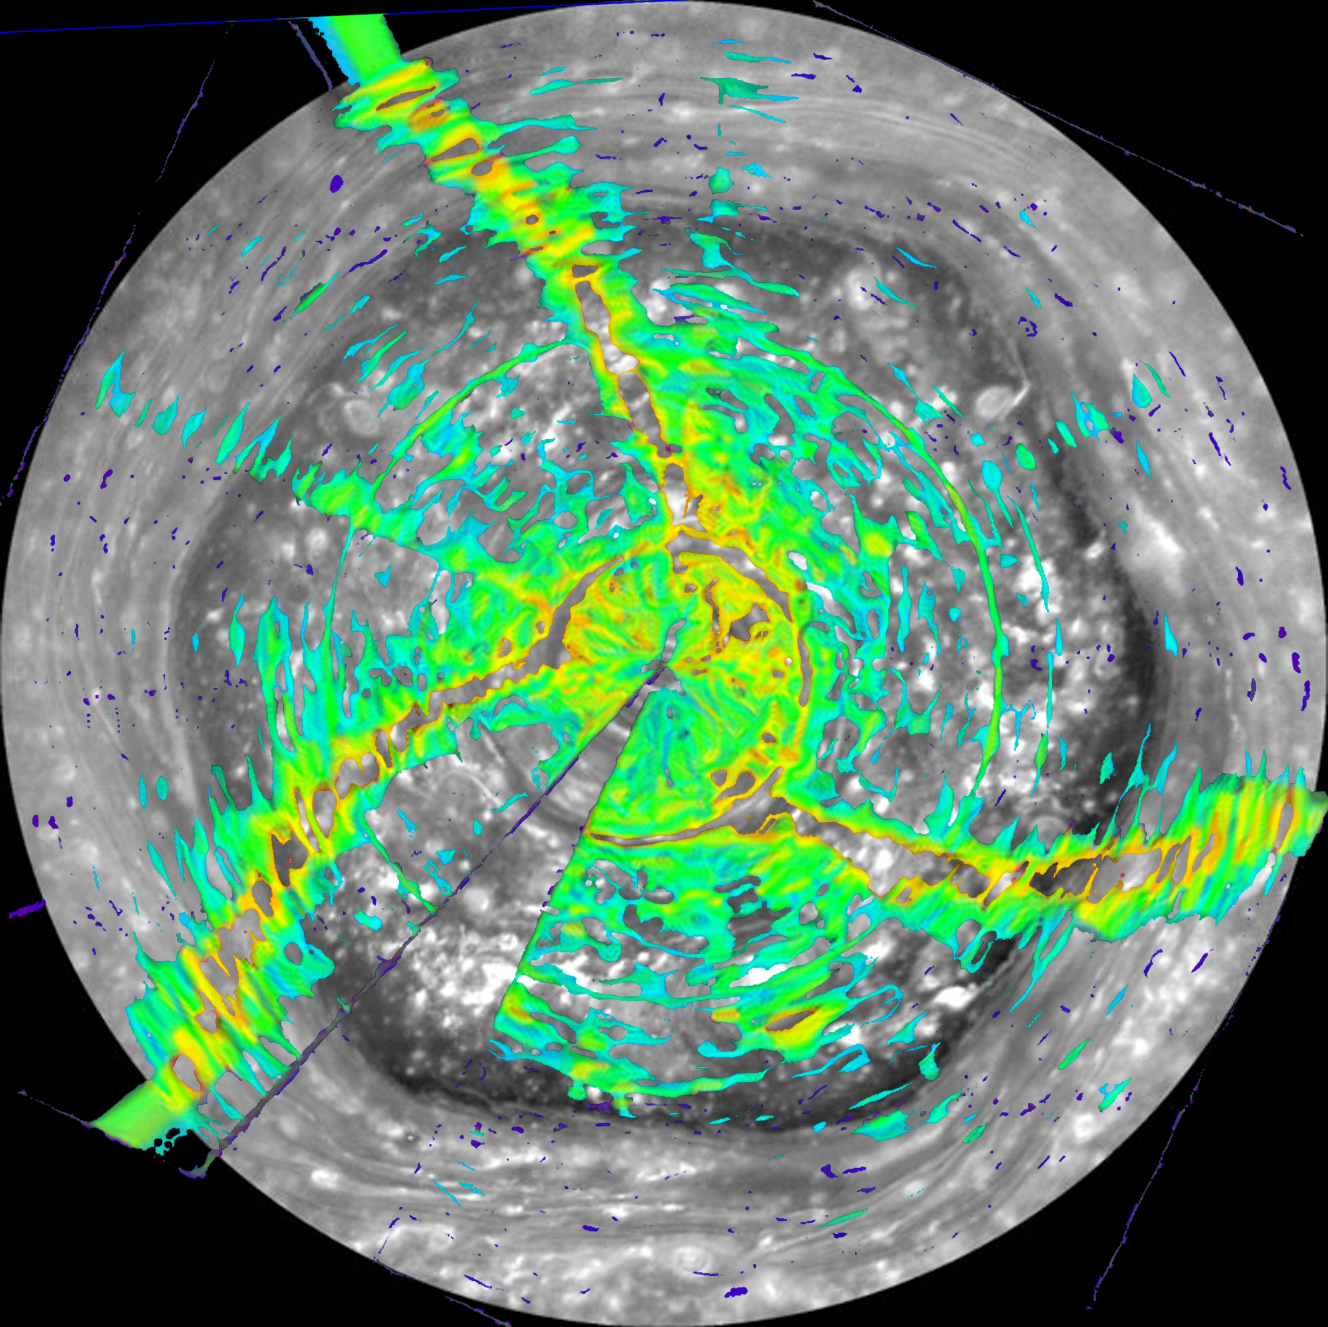
Features in the radio kilometric data from the Cassini probe matches up with those seen in the Saturn Hexagon. Mouse over the image to compare the kilometric data and the photograph. Is there a relationship?
There is a good deal of noise in the kilometric data, which doesn’t appear to match up with any of the storms in the hexagon. However, it could be that the two images were taken at different times when the storms were in different positions.